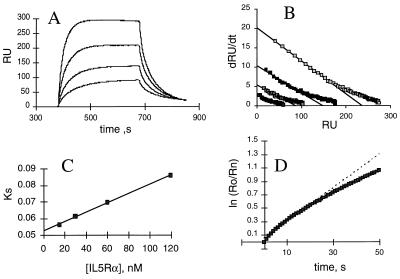
Figure 4.
Binding kinetics of DABC with shIL-5Rα. (A) Overlays of sensorgrams for binding of various concentrations of shIL-5Rα to DABC captured by mAb 4A6 on the sensor chip. Receptor samples of 15, 30, 50, and 120 nM were injected. The increase in response shows the binding of shIL-5Rα. The flattened plateau indicates equilibrium is reached. The decay represents the dissociation of bound shIL-5Rα. Data analyses in B–D were as described (26). (B) dR/dt plots of association data. The slopes of the linear portions of these plots yield ks values. (C) ks plot. The slope of this plot yields kon. (D) Natural log plot of dissociation data for 120 nm shIL-5Rα sensorgram. The linear fit of the first 25 sec of data yielded koff.

