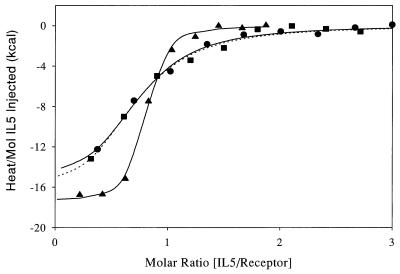
Figure 6.
Titration calorimetry data for dimeric and monomeric forms of IL-5 binding to IL-5R. Heat per mol of IL-5 added at each injection is shown versus the cumulative ratio of IL-5 mol added per mol of receptor. For all cases the ≈75 μM IL-5 construct was titrated as 5–10 μl volumes into the calorimeter which contained 1.3 μM receptor. ▴, wtIL-5; •, DABC; and ▪, GM1. Best-fit regression curves are: wtIL-5 and DABC (solid line), and GM1 (dotted lined). Conditions are as in Table 2.

