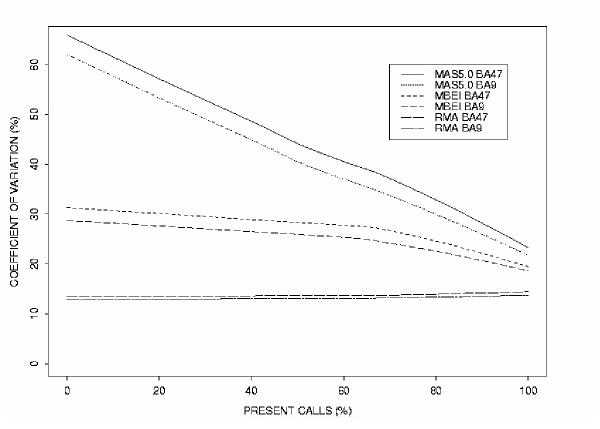
Figure 1.
MAS5.0, MBEI and RMA signal variability. The variability in signal intensity measurement obtained with three different probe-level data extraction methods is represented by the lowess curves of the coefficient of variation. The X-axis represent increasing signal intensities, as measured by the percentage of arrays on which this gene is detected as present (% present calls). Presence calls were obtained with MBEI (BA9, n = 39; BA47, n = 36). Note that curves for the two brain areas are very close to each other for all three methods.

