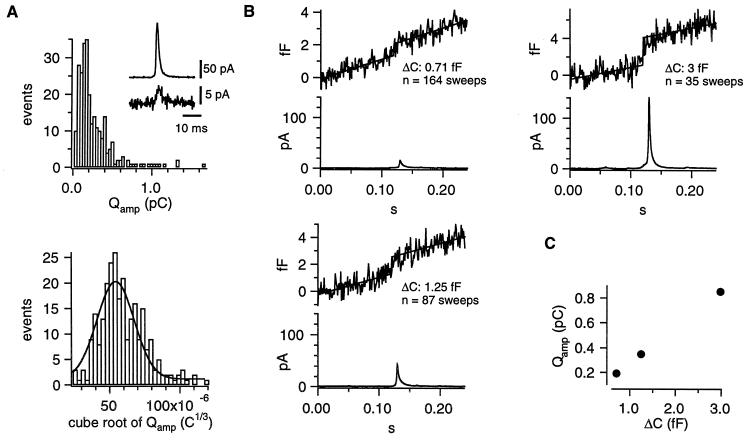
Figure 1.
Analysis of amperometric spikes and single vesicle capacitance during secretion of isolated chromaffin cells. Cells were stimulated by intracellular perfusion with high [Ca2+] (internal solution 2) and bathed in Ringer’s solution (external solution 2). (A) The top graph shows the distribution of the current integrals (Qamp) of the fastest amperometric spikes (risetime <1.5 ms). The Inset displays the smallest fast spike (peak amplitude ≈4 pA) detected and compares it it to a large one, recorded during the same experiment. The lower graph displays the 3 histogram. A Gaussian fit (solid line) is superimposed. Its mean and SD were 54.2 × 10⁻⁶ and 18.7 × 10⁻⁶ C1/3, respectively. (B) Time-locked ΔCm (Upper) and amperometric current (Lower) averages for three groups. Top, left: spikes <23 pA; bottom, left: spikes >23 pA but <70 pA; right, top: spikes >70 pA. The Δc values were estimated as the y − difference of two parallel lines fitted to the average trace (up to 20 ms before the spike-peak, and from 20 ms after the spike-peak). (C) Plot of the Qamp of the average spikes versus Δc.

