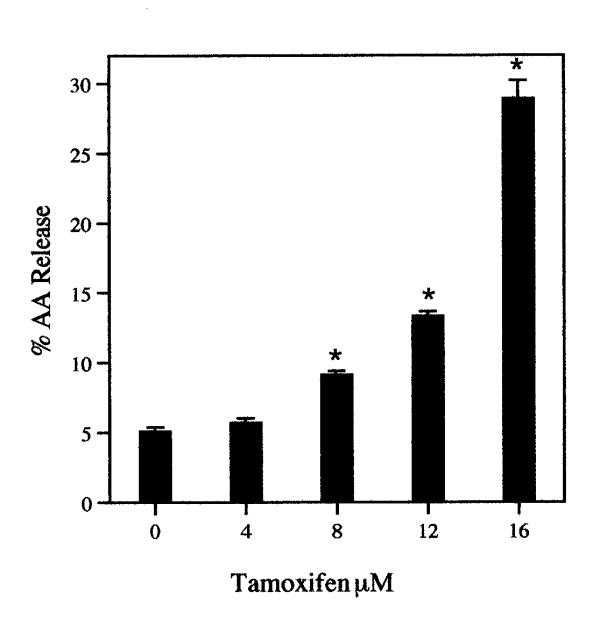
Figure 1.
The dependence of AA release on tamoxifen concentration. The cells were incubated for 6-h. The analyses were performed with triplicate dishes. Each bar gives the mean value and the brackets give the SEM. * = statistically different vs control. These data are representative of several independent experiments with the same results.

