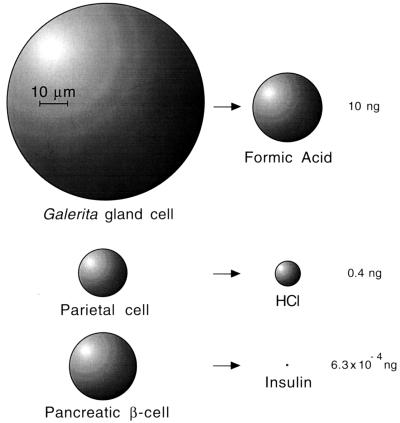
Figure 7.
Comparison of hourly secretory output of G. lecontei gland cells, human parietal cells, and human pancreatic β-cells. Values for the latter two cell types were calculated from data in the literature (27–29). All cells are to scale shown. Spheres denoting secretion droplets are based on density = 1 for each substance.

