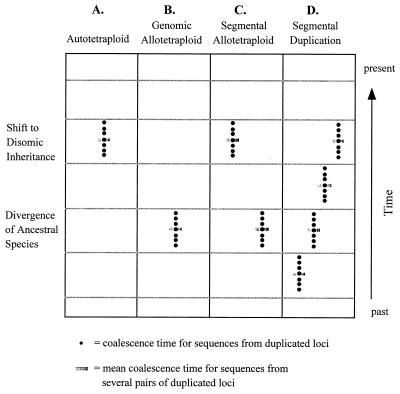
Figure 1.
Diagrammatic representation of the expected distribution of coalescent times under the four models of chromosomal duplication. Columns: A, The autotetraploid model under the assumption that the switch to disomy is coordinated among chromosomes; B, the genomic allotetraploid model; C, the segmental allotetraploid model; D, the model of segmental duplication.

