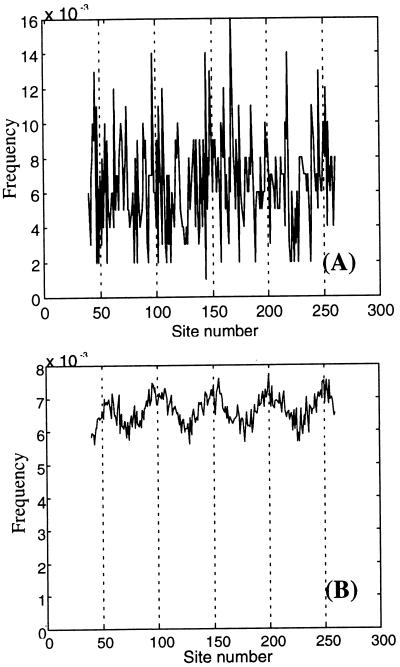
Figure 4.
(A) The nonrandomness of intron distribution along the gene is effectively undetectable when slippage rates are as high as was estimated in our maximum likelihood analysis and the number of independent present-day genes under analysis is not unrealistically large (<10,000). The figure shows a frequency distribution of introns that was computed through averaging 1,000 “present-day” genes obtained in computer simulation (broken lines indicate positions of the “ancestral” introns). (B) To significantly prove the nonrandomness of intron distribution for the same model and parameter values one needs a very large sample of present-day genes. This frequency distribution of intron positions was obtained by “averaging” over 100,000 present-day genes from the computer simulation.

