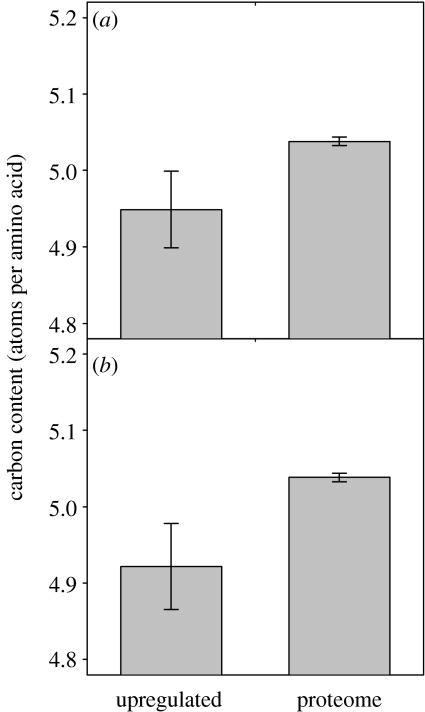
Figure 2.
Mean (±2 s.e.) carbon content (atoms per amino acid) of yeast proteins whose genes had greater expression in ancestral strains responding to carbon limitation than in strains artificially selected under carbon limitation, and mean (±2 s.e.) carbon content (atoms per amino acid) of the rest of the proteins in the proteome. Data are presented for two studies, (a) Ferea et al. (1999) and (b) Jansen et al. (2005).

