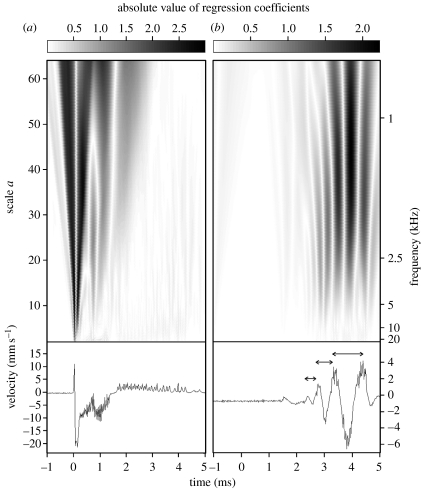
Figure 1.
Scalograms (two-dimensional plots of continuous wavelet transform) and oscillograms of signals recorded by the two distant lasers focusing on a rush stem. (a) The first laser recorded a typical transient signal generated by the falling ball. The scalogram indicates a wide-band spectrum. The second laser recorded the signal after its propagation through the plant at 45 cm from the impact point. Because of dispersion phenomenon, the signal recorded (b) after propagation shows high frequencies arriving first, leading lower frequencies (see arrows). This phenomenon is, however, true only for frequencies lower than 5 kHz. Y-axis of oscillograms refers to signal velocity but not to wave velocity. Note the change of range between the oscillograms. For convenience, wavelet scale a has been converted into frequency scale (kHz). Horizontal grey level bar indicates the range for the absolutes values of regression coefficients.

