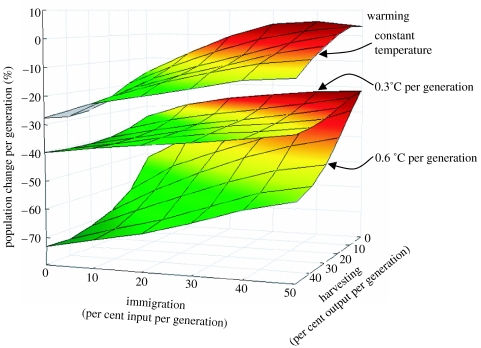
Figure 2.
Changes in population density, per generation, of populations exposed to harvesting and reductions in immigration, when facing constant and warming temperatures. The contours in the graph were based on averages of four replicated microcosms for each interaction of treatments. The raw data of this figure appear in table 2 in the electronic supplementary material.

