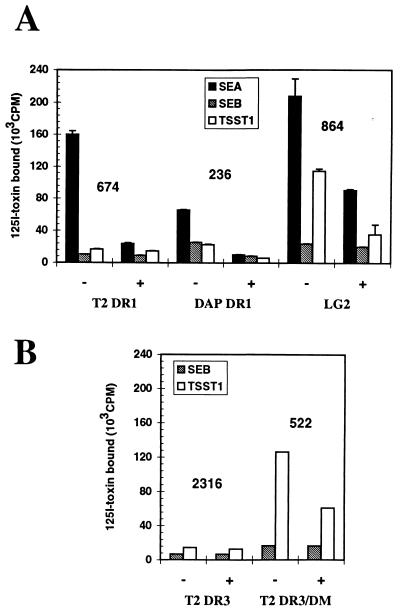
Figure 4.
Binding of SAgs to DM+ and DM-T2 cells. (A) Comparison of the binding of SEA, SEB, and TSST-1 on T2 DR1 cells, LG2, or DAP DR1 cells. (B) SEB and TSST-1 binding was compared in T2 DR3 cells with or without HLA-DM expression. Efficient binding of all three toxins is confirmed on DAP DR1 and LG2 cells as a control. The numbers represent the mean of fluorescence in cytofluorometry (FACScan; Becton Dickenson) for each cell line as detected using the L243 anti-DR antibody.

