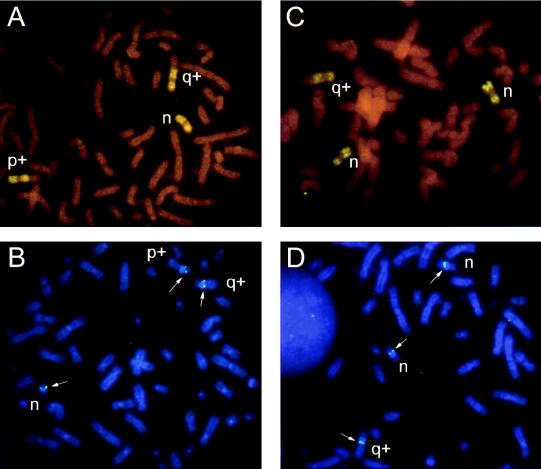
Figure 5.
FISH analysis of cell line GLC2. (A) Chromosome 16 paint showing the normal (n), and the two rearranged 16s (q+, p+) observed in 75% of the cells. (B) FISH signals (arrows) at 16q12–13 on all three chromosomes 16 obtained with the p130 gene. (C) Chromosome 16 paint showing the two normal (n) and the single rearranged (q+) chromosome 16 observed in 25% of the cells. (D) FISH signals (arrows) of p130 at 16q12–13 on all three chromosomes 16 obtained with the p130 gene.

