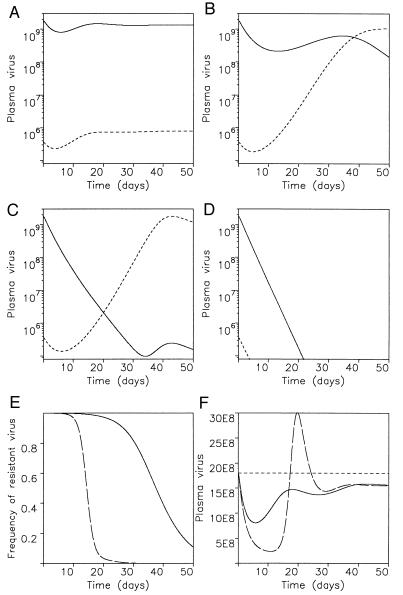
Figure 3.
Dynamics of drug treatment if resistant virus is present before therapy. Before treatment, the basic reproductive ratios of wild-type and mutant virus are given by R1 and R2, respectively. Drug therapy reduces the basic reproductive ratios to R′1 and R′2. There are four possibilities depending on dosage and efficacy of the drug: (A) If R′1 > R′2, then mutant virus is still outcompeted by wild type. Emergence of resistance will not be observed. Equilibrium virus abundance during treatment is similar to the pretreatment level. (B) If R′2 > R′1 > 1, resistance will eventually develop, but the initial resurgence of virus can be due to wild type. (C) If R′2 > 1 > R′1, resistant virus rises rapidly. In B and C the exponential growth rate of resistant virus is approximately given by a(R′2 − 1), thus providing an estimate for the basic reproductive ratio of resistant virus during treatment. (D) If 1 > R′1, R′2, then both wild-type and resistant virus will disappear. (E) A stronger drug will lead to a faster rise of resistant virus, if it exerts a larger selection pressure. (F) The total benefit of drug treatment, as measured by the reduction of virus load during therapy integrated over time, ∫t (v(t) − v*)dt, is largely independent of the efficacy of the drug to inhibit wild-type replication. A stronger drug leads to a larger initial decline of virus load, but causes faster emergence of resistance. Parameter values: λ = 107, d = 0.1, a = 0.5, u = 5, k1 = k2 = 500, β1 = 5 × 10⁻¹⁰, β2 = 2.5 × 10⁻¹⁰. Hence, R1 = 10 and R2 = 5. Treatment reduced β1 and β2 such that: (A) R′1 = 3, R′2 = 2.5; (B) R′1 = 1.5, R′2 = 2.25; (C) R′1 = 0.5, R′2 = 2; (D) R′1 = 0.1, R′2 = 0.5; and (E and F) R′1 = 3, R′2 = 4.5 (continuous line) and R′1 = 1.5, R′2 = 4.5 (broken line). In A–D the continuous line is wild-type virus, whereas the broken line denotes mutant.

