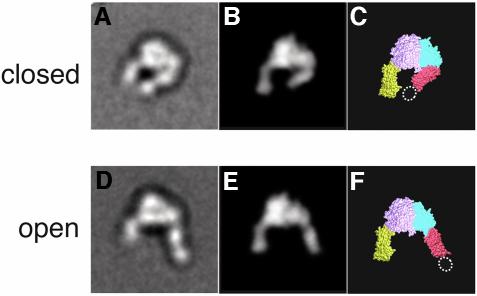
Fig. 3. Two different integrin headpiece conformations. A representative projection average from (A) unliganded and (D) liganded α5β1 headpiece was used to identify the best-correlating projections calculated from a 25 Å density map created from αVβ3 headpiece models (B and E). The model for the open αVβ3 headpiece was prepared as described in the text and Materials and methods section. The models are shown in CPK representation (C and F) using the same color code as in Figure 1A.

An official website of the United States government
Here's how you know
Official websites use .gov
A
.gov website belongs to an official
government organization in the United States.
Secure .gov websites use HTTPS
A lock (
) or https:// means you've safely
connected to the .gov website. Share sensitive
information only on official, secure websites.
