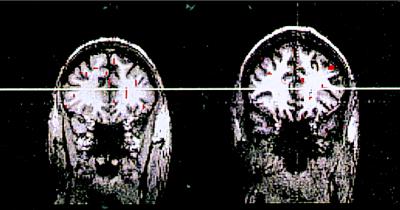
Figure 2.
Comparison of ROIs between individual subjects (Random minus Repeat; sensorimotor task) in the anterior slice. The thresholding for the individual subject ROIs are P < 0.01 (red only). The individual subject ROIs are spatially correlated with the mean ROIs within experimental error. The white horizontal lines delineate poorly shimmed regions (see Results).

