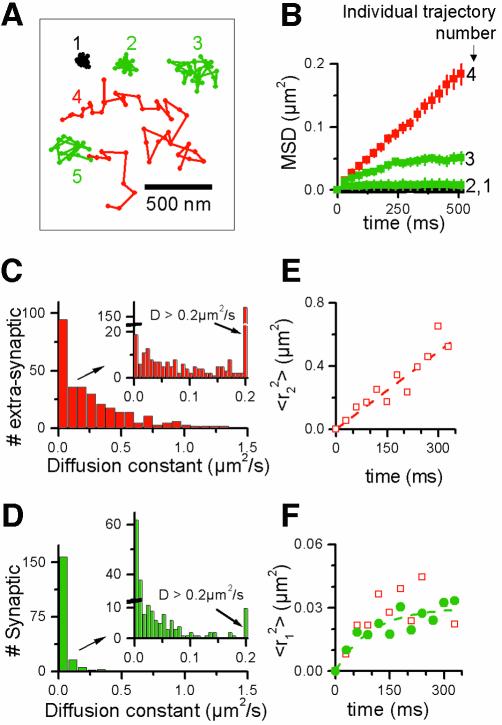
Fig. 2. (A and B) Illustrative examples of AMPARs movements. (A) Examples of trajectories of individual molecules. Cy5-anti-GluR2 fixed on a coverslip (1). The other trajectories correspond to single Cy5-anti-GluR2 bound to AMPARs in living dendrites. The trajectories recorded in synaptic regions (see text) are indicated in green. The trajectories recorded in extra-synaptic domains are indicated in red. Trajectories 2 and 3 stayed within synaptic sites; trajectory 4 evolved entirely in the extra-synaptic membrane; trajectory 5 started in an extra-synaptic region and then entered a synaptic site. (B) Plots of the MSD versus time intervals τ for four trajectories shown in (A). Trajectories 2 and 3, which were both synaptic, were less mobile than trajectory 1, but differed: trajectory 2 corresponds to a slowly mobile receptor in a confined area, 3 to an immobile receptor. (C–F) Statistical analysis of AMPAR movements. (C and D) Differential mobility of synaptic and extra-synaptic AMPARs measured at 37°C in the presence of TTX. (C) Histograms of the instantaneous diffusion constant for 306 AMPARs trajectories detected in extra-synaptic regions of >20 neurons. (D) Same histograms for 187 AMPARs trajectories detected in synaptic sites of >20 neurons. Binning of the major histograms is 0.075 µm2/s. The insets correspond to the same data with a binning of 0.007 µm2/s. (E and F) Single-molecule analysis of AMPARs diffusion: plots of the mean MSD <r21 (τ)> and <r22 (τ)> derived from the analysis of the square displacements for τ = n × 30 ms (n = 1–11). (E) <r22 (τ)> is linear with time and reveals free diffusion for fast diffusing extra- synaptic AMPARs. (F) <r21 (τ)> are undistinguishable for synaptically located (filled circle) and slowly diffusing extra-synaptic (open squares) trajectories and reveal confined movement.

An official website of the United States government
Here's how you know
Official websites use .gov
A
.gov website belongs to an official
government organization in the United States.
Secure .gov websites use HTTPS
A lock (
) or https:// means you've safely
connected to the .gov website. Share sensitive
information only on official, secure websites.
