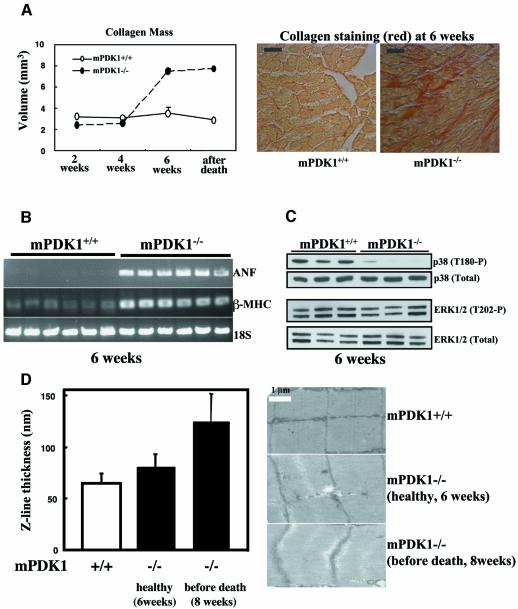
Fig. 5. Analysis of markers of heart failure. (A) Histological sections of mPDK1+/+ and mPDK1–/– hearts of the indicated ages or after death were stained with Picric-Sirius Red dye, which stains collagen in red. The amount of collagen present in these sections was quantified using the Cavalieri method. The data are presented as the mean ± SD of three separate hearts of each age and genotype. Representative micrographs of Picric-Sirius Red-stained 6-week-old mPDK1–/– and mPDK1+/+ heart sections are shown. (B) RNA was isolated from mPDK1–/– and mPDK1+/+ hearts of 6 weeks of age, and RT–PCR analysis, described in the materials and methods, was employed to assess the mRNA expression levels of atrial natriuretic factor (ANF), β-myosin heavy chain (β-MHC) and 18S ribosomal RNA (18S) as a control. Each lane on the agarose gel represents a different mouse. (C) Cell extracts were prepared from mPDK1–/– and mPDK1+/+ hearts of 6 weeks of age and immunoblotted with the indicated antibodies. Each lane on the immunoblot represents a different mouse. (D) Electron microscope sections of mPDK1+/+ and mPDK1–/– hearts of the indicated ages. The Z-line thickness was quantitated by counting 135 randomly derived Z-lines from three hearts of each genotype and age. The data are presented as average thickness ± SD.

An official website of the United States government
Here's how you know
Official websites use .gov
A
.gov website belongs to an official
government organization in the United States.
Secure .gov websites use HTTPS
A lock (
) or https:// means you've safely
connected to the .gov website. Share sensitive
information only on official, secure websites.
