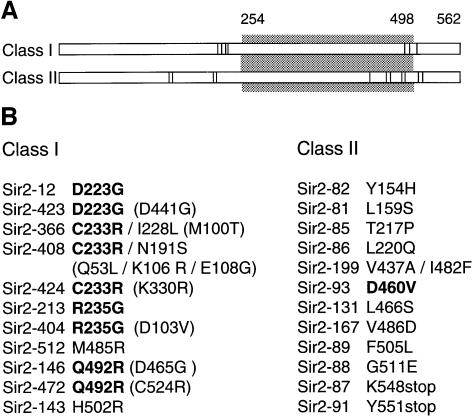
Fig. 3. Mutations responsible for class I and class II phenotypes. (A) Graphical representation of Sir2p, depicting location of class I and class II mutations. The gray box indicates the highly conserved core domain of Sir2p (amino acids 254–498) and the mutated residues conferring class I and class II phenotypes are represented by black bars. (B) A list of mutations, divided according to class. Mutations in bold letters have been identified more than once, whereas those in parentheses do not contribute to the silencing phenotype of the mutant and have no effect on silencing when recloned by themselves. These changes are shown because some subsequent assays were performed with alleles containing these mutations. We observed an average of 2.8 mutations per clone for class I mutants, and 2 mutations per clone for class II mutants, including silent mutations. Because of the relative abundance of class II mutants, only those containing a minimum number of mutations were selected for subsequent analysis. The following pairs of mutants behaved similarly in all the subsequent assays, and thus only one mutant per group is shown in subsequent figures: sir2-12/sir2-423, sir2-146/sir2-472, sir2-213/sir2-404 and sir2-366/sir2-408/sir2-424. A summary of mutant phenotypes is shown in Supplementary Tables I and II, available at The EMBO Journal Online.

An official website of the United States government
Here's how you know
Official websites use .gov
A
.gov website belongs to an official
government organization in the United States.
Secure .gov websites use HTTPS
A lock (
) or https:// means you've safely
connected to the .gov website. Share sensitive
information only on official, secure websites.
