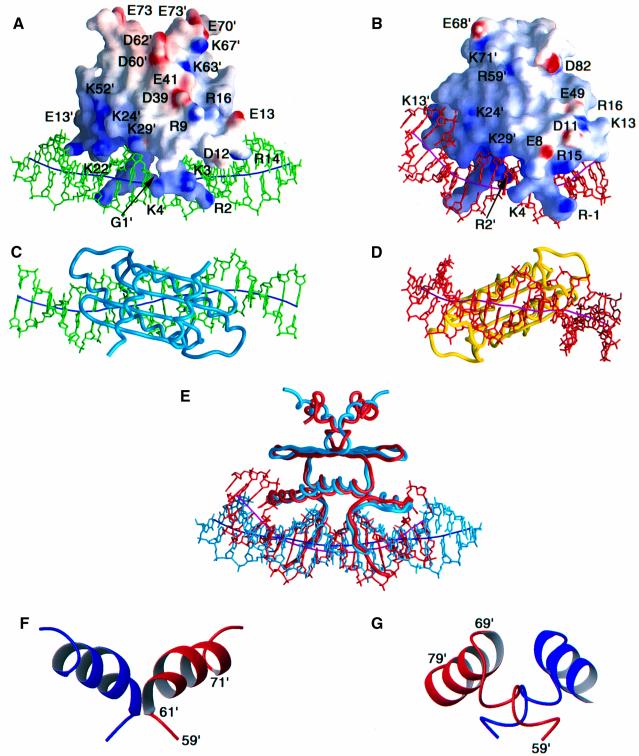
Fig. 3. Comparison of the structures of the MEF2A–DNA and SRF–DNA complexes. Two views of the complete MEF2A–DNA and SRF–DNA complexes are shown in (A) and (C) and (B) and (D), respectively; a superimposition of the two complexes best-fitted to the MADS-box is shown in (E) in the same orientation as in (A) and (B); and ribbon diagrams of the MEF2S and SAM domains are shown in (F) and (G), respectively. The electrostatic potential (blue positive and red negative) mapped onto the molecular surface of the proteins is displayed in (A) and (B). The DNA and the path of its long axis are displayed in green and dark blue, respectively, for the MEF2A–DNA complex (A and C), and in red and purple, respectively, for the SRF–DNA complex (B and D). The proteins are displayed as backbone worms in (C), (D) and (E). In (E), the MEF2A–DNA complex is shown in light blue and the SRF–DNA complex in red. Residues 1–74 of MEF2A are displayed in (A), (C) and (E). In (F) and (G) the two subunits are represented in red and blue; the orientation of the MEF2 and SAM domains shown in (F) and (G) is the same as that in (A), (B) and (E). The coordinates of the SRF–DNA complex are taken from Pellegrini et al. (1995) (PDB accession code 1SRS).

An official website of the United States government
Here's how you know
Official websites use .gov
A
.gov website belongs to an official
government organization in the United States.
Secure .gov websites use HTTPS
A lock (
) or https:// means you've safely
connected to the .gov website. Share sensitive
information only on official, secure websites.
