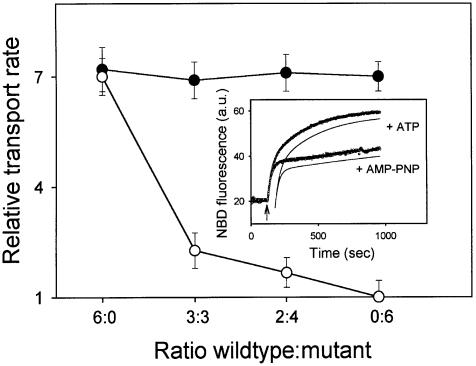
Fig. 2. Negative dominance of an NEM-inactivated single-cysteine LmrA mutant in proteoliposomes containing co-reconstituted wild-type and mutant LmrA proteins. The transport activity in proteoliposomes was measured using fluorescent C6-NBD-PE as a substrate. Inset: typical NBD fluorescence traces obtained for proteoliposomes containing wild-type LmrA in assay mixtures supplemented with ATP or non-hydrolyzable AMP-PNP demonstrate the experimental and analytical methods used. At the onset of transport measurement, C6-NBD-PE was present in donor liposomes in which the NBD fluorescence was low due to the presence of N-Rh-PE quencher. Addition of proteoliposomes at the arrow resulted in the movement of C6-NBD-PE, but not of the N-Rh-PE quencher, from donor liposomes to proteoliposomes with a concomitant increase in NBD fluorescence. The increase in NBD fluorescence observed was deconvoluted by a double exponential fit of the data (see Materials and methods), which is shown displaced from the fluorescence traces for clarity, yielding a rate constant k1 for the interbilayer movement of C6-NBD-PE between donor liposomes and proteoliposomes, and a rate constant k2 for the transbilayer movement of the probe in the proteoliposomes. Main figure: NBD-PE transport was measured in the presence of ATP or AMP-PNP, using proteoliposomes containing the cysteine-less wild-type LmrA and the G386C mutant form of LmrA at the molar ratios indicated, before (filled circles) and after (open circles) NEM treatment of the proteoliposomes. In all experiments k1 values were of the order of 0.038–0.041 s–1, and were at least 10 and 70 times the k2 values obtained for incubations containing ATP or AMP-PNP, respectively. Hence, the transbilayer movement of C6-NBD-PE could be explicitly characterized, separate from the interbilayer movement. The relative transbilayer transport rate, as depicted in the graph, was calculated from the estimated k2 values using the equation: vrel = vATP/vAMP-PNP = k2ATP/k2AMP-PNP. The k2 values obtained for proteoliposomes in incubations supplemented with AMP-PNP were relatively constant, and of the order of 0.00052–0.00058 s–1.

An official website of the United States government
Here's how you know
Official websites use .gov
A
.gov website belongs to an official
government organization in the United States.
Secure .gov websites use HTTPS
A lock (
) or https:// means you've safely
connected to the .gov website. Share sensitive
information only on official, secure websites.
