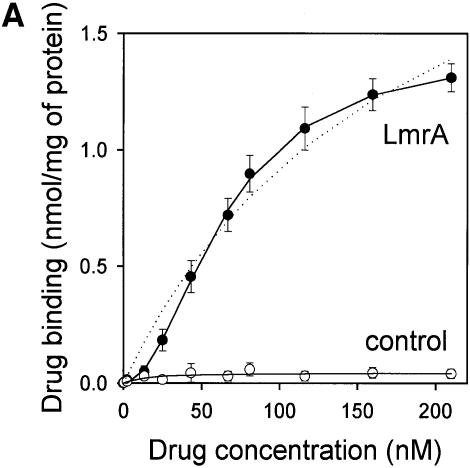
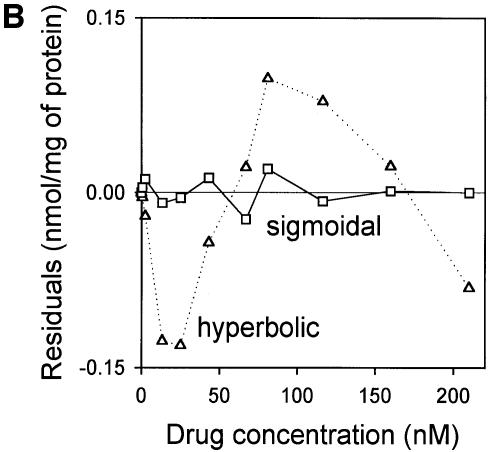
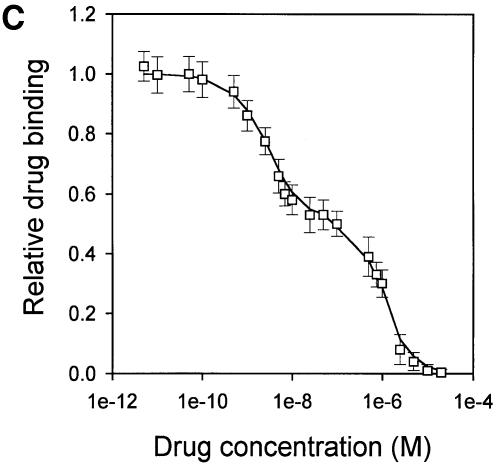
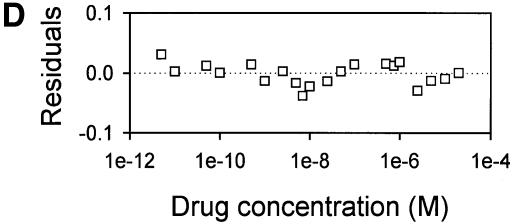
Fig. 4. Vinblastine equilibrium binding to LmrA. (A) Specific binding of [3H]vinblastine to inside-out membrane vesicles without LmrA (control) or with LmrA, as a function of the free vinblastine concentration. Superimposed on the data are the best fit curves obtained for a single-site binding model (hyperbolic, dotted curve), the cooperative two-site binding model (sigmoidal, solid curve) and the Hill equation (indistinguishable from the sigmoidal, solid curve). (B) Residual variance between the data and the best fitting hyperbola and sigmoidal curves from (A), plotted as a function of the free vinblastine concentration. Note the systematic deviation of the residual variance of the data for the hyperbola, indicating that the single-site model provides an inadequate fit to the data. The residual variance between the data and the sigmoidal curve shows only random scatter, suggesting that the data are adequately fitted by the cooperative two-site binding model. (C) Heterologous displacement of vinblastine from LmrA by CP100-356. LmrA was saturated with [3H]vinblastine at a concentration of 192 nM, and vinblastine displacement from LmrA by CP100-356 measured at increasing concentrations of CP100-356. The data were fitted by the cooperative two-site drug-binding model in which direct competition was introduced between vinblastine and CP100-356 for binding to the two drug-binding sites in the LmrA transporter. A relative binding value of 1 represents 1.42 nmol vinblastine/mg of membrane protein. (D) Residual variance between the experimental data and the best fitting curve from (C), showing random scatter of the data around the predicted curve.

An official website of the United States government
Here's how you know
Official websites use .gov
A
.gov website belongs to an official
government organization in the United States.
Secure .gov websites use HTTPS
A lock (
) or https:// means you've safely
connected to the .gov website. Share sensitive
information only on official, secure websites.


