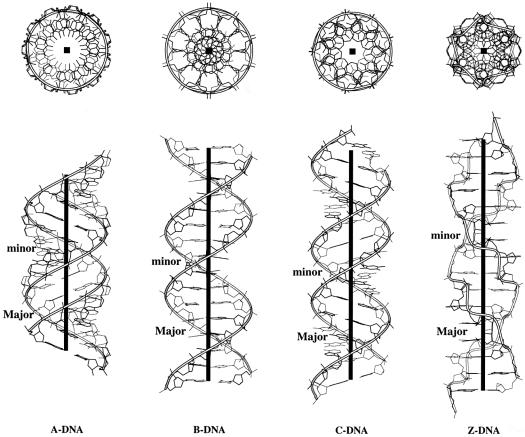
Figure 9.
Top and side views illustrating the characteristic features of regular helical structures of A, B, C and Z DNA deduced from representative X-ray fiber diffraction models (44,46). Ribbons trace the progression of the backbone defined by the phosphorus atoms and the heavy black lines (boxes) represent the helical axes.

