
Figure 4.
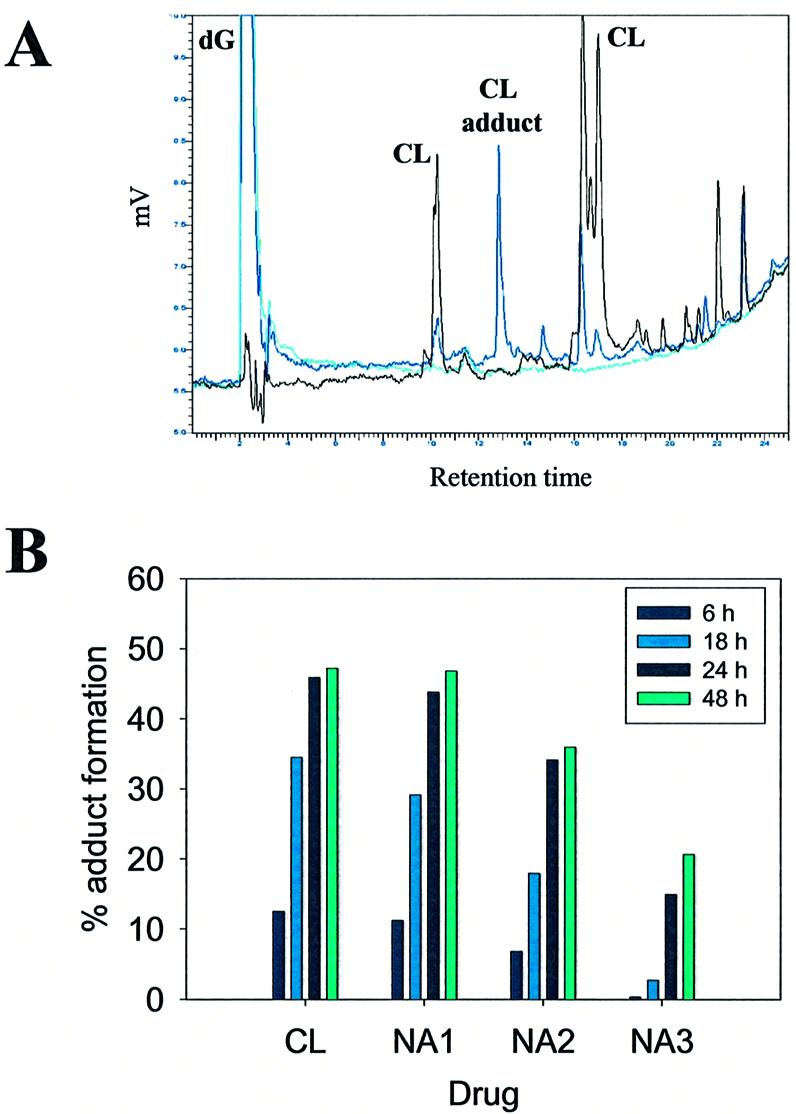
Adduct formation in reactions of CL and derivatives with dG. (A) Chromatogaphic profile for CL-dG reaction. Chromatographic profiles for CL-dG (black line), CL (dark blue line) and dG (light blue line) treated at 37°C for 24 h are shown overlapped. Peak identities are shown above each peak. (B) Relative yields of adduct formation. CL and its NA analogues were reacted with dG for 6, 18, 24 and 48 h. The incubation temperature was set at 37°C for reaction with CL, NA1 and NA2, at 60°C for reaction with NA3. Adduct peaks were identified through comparison of chromatograms obtained from reaction mixtures and free drugs, both treated in the same conditions. For each drug, the percentage of adduct formation was calculated from the ratio of the area of adduct peaks over total peak area.