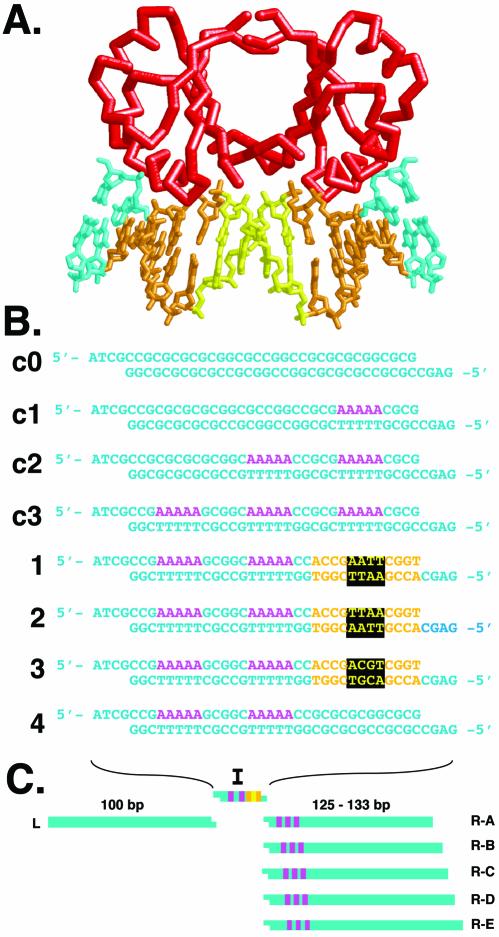
Figure 1.
E2/DNA interaction and DNA curvature analysis. (A) Schematic representation of HPV-18 E2 binding protein (red) in complex with E2 binding site DNA. DNA recognition sequences are shown in gold, the spacer sequence in yellow, and flanking sequences in cyan. The model is based on Kim et al. (6) (PDB code 1JJ4). (B) DNA sequences analyzed in this study. Inserts c0–c3 are curvature standards containing zero to three phased A5 tracts (magenta). Inserts 1–3 contain two phased A5 tracts and a single E2 binding site with a different spacer sequence in each case [color coding as in (A)]. Insert 4 contains two phased A5 tracts and no E2 binding site. (C) Semi-synthetic phasing assay for electrophoretic measurement of intrinsic DNA curvature within inserts 1–4. A single left arm (L) participates in trimolecular ligations with the insert (I) of choice, and each of five possible right arms (R-A through R-E). Each ligation product creates a different spacing between the insert sequences and the three phased A5 tracts of the right arm.

