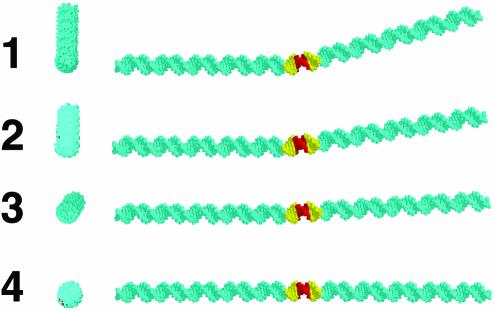
Figure 2.
Predicted DNA curvature. Molecular models depict end views (left) and side views (right) of the 12 bp E2 recognition sites of inserts 1–4, positioned between 56 bp segments of intrinsically straight DNA. Structures were predicted by the Liu–Beveridge model (10) (see Materials and Methods). Atoms corresponding to the E2 recognition sites and N4 spacers sequence are shown in gold and red, respectively.

