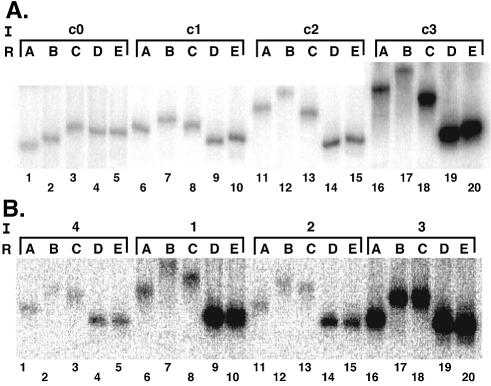
Figure 3.
Semi-synthetic phasing analysis of intrinsic DNA curvature. (A) DNA curvature analysis with the indicated standard inserts (I) containing zero to three phased A5 tracts ligated to the left DNA arm and the indicated right arm (R). (B) Phasing analysis for inserts 1–4 (see Fig. 1) containing E2 binding sites with different spacer sequences.

