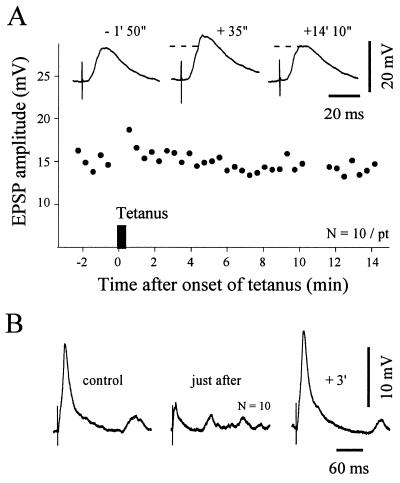
Figure 2.
Effects of subthreshold cortical tetanic stimulation on striatal neurons at resting membrane potential. (A) Example of posttetanic potentiation. The graph shows the time course of the amplitude of striatal EPSPs evoked by single test stimuli applied in the facial motor cortex. ▪, The cortical tetanization (train of 1 sec at 100 Hz repeated two times at 10-sec interval, resting membrane potential = −73 mV). The same intensity was used for the test stimulus and the tetanic stimulation. Note that after a short-term posttetanic potentiation, the synaptic efficacy recovered its control level. Traces represent the averaging of 10 successive EPSPs obtained at the indicated times before and after tetanus. The dashed lines indicate the amplitude of the control EPSPs. (B) Example of a short-term depression. Traces represent averaged evoked EPSPs (n = 10) obtained at the indicated periods. Parameters of tetanus: train of 2 sec at 100 Hz repeated 4 times at 10-sec interval, resting membrane potential = −85 mV.

