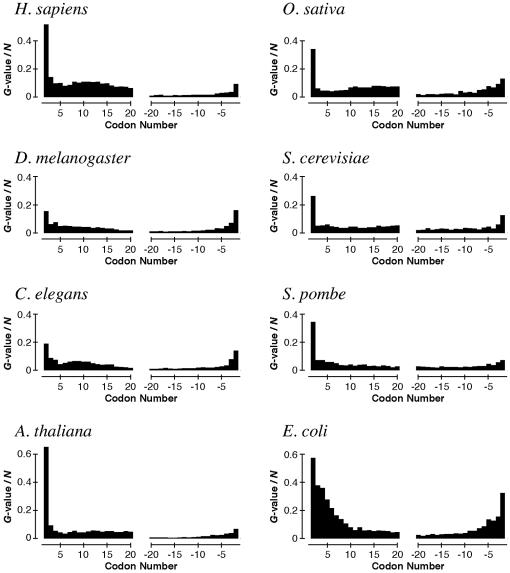
Figure 1.
Biases in codon appearance at each position in genes of seven eukaryotes and E.coli. The biases are represented as the G-values divided by the gene number N (see Materials and Methods). The initiation and the termination codons are omitted, because the G-values at these codons are extremely high.

