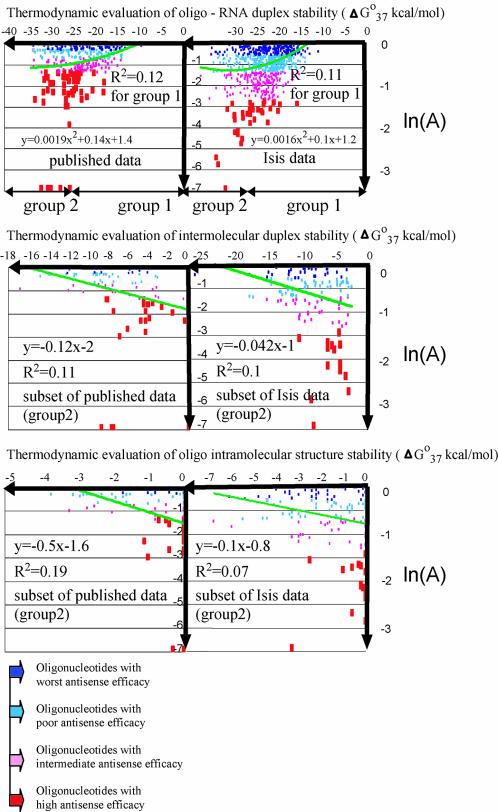
Figure 1.
Scatter plots showing the relationship between thermodynamic parameters and antisense oligonucleotide activities from both databases. Activity values (A) are expressed as the ratio of the level of a particular mRNA or protein measured in cells treated with an antisense oligonucleotide, to the level of the same mRNA or protein in untreated cells. Linear or non-linear trend lines are shown in each scatter plot.

