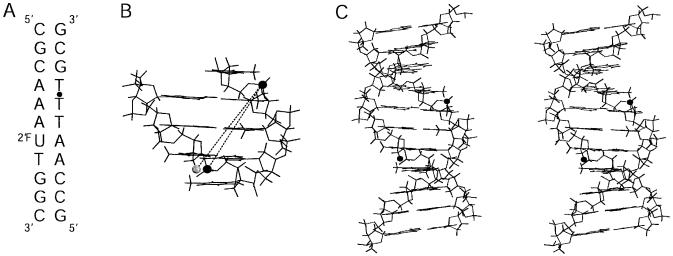
Figure 2.
(A) The A3T2 DNA sequence used in this study. 2′FU indicates 2′-fluoro-2′-deoxyuridine and the dot between T18 and T19 denotes a phosphorothioate. (B) Expanded view of A3T2 DNA showing label positions corresponding to standard and P-F REDOR measures of minor groove width across the central A3T2 tract. The dark sphere at upper right marks the i phosphate (T19); on the lower left, the dark sphere indicates the i + 3 phosphate (T8), while the light sphere indicates the 2′F label used in the present experiments. The standard B-form DNA model for the A3T2 oligomer was generated using the biopolymer module of Insight II (Biosym). (C) Stereoview of the free A3T2 DNA generated using Insight II. Dark spheres show location of phosphorothioate and 2′FU.

