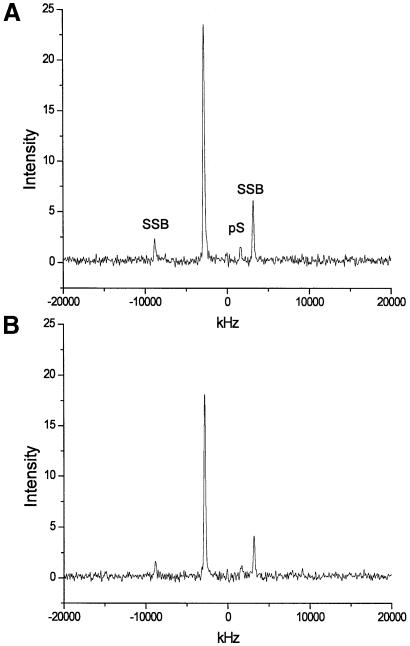
Figure 4.
REDOR S and So spectra for the 2:1 distamycin:A3T2 DNA complex. Plots were generated without line broadening and show absolute intensities. (A) Reference (So) 31P spectrum, where pS denotes the phosphorothioate signal. The large central peak and its spinning side bands (SSB) are due to unmodified backbone phosphates. (B) Experimental (S) REDOR spectrum, showing diminished 31P backbone and phosphorothioate peak intensities following application of 19F pulses.

