Figure 2.
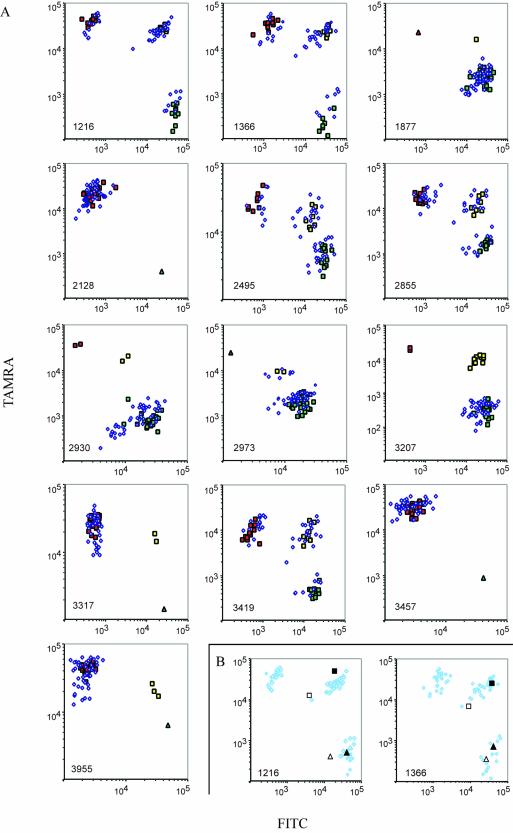
(Opposite) Results from parallel gene analysis. (A) Seventy-five individuals were genotyped at 13 loci. Signal intensities from FITC- and TAMRA-labeled PCR products were plotted on logarithmic x- and y-axes, respectively. Locus identities are shown in the lower left corners. Individuals with confirmed genotypes that were homozygous for allele 1 at any locus are identified by green squares, homozygotes for allele 2 by red squares and heterozygotes by yellow squares. Blue diamonds represent individuals that have not been investigated by other genotyping techniques. Oligonucleotide targets representing all homozygous genotypes were also assayed, and included in the graphs if any of the homozygous genotypes were not represented in our set of samples (triangles). (B) Parallel genotyping of cDNA samples (open squares and triangles) from two liver necropsies and the corresponding genomic samples (filled squares and triangles). The results from two loci are plotted with the results from 75 genomic samples (A) shown as shaded diamonds to indicate the genotype clusters.

