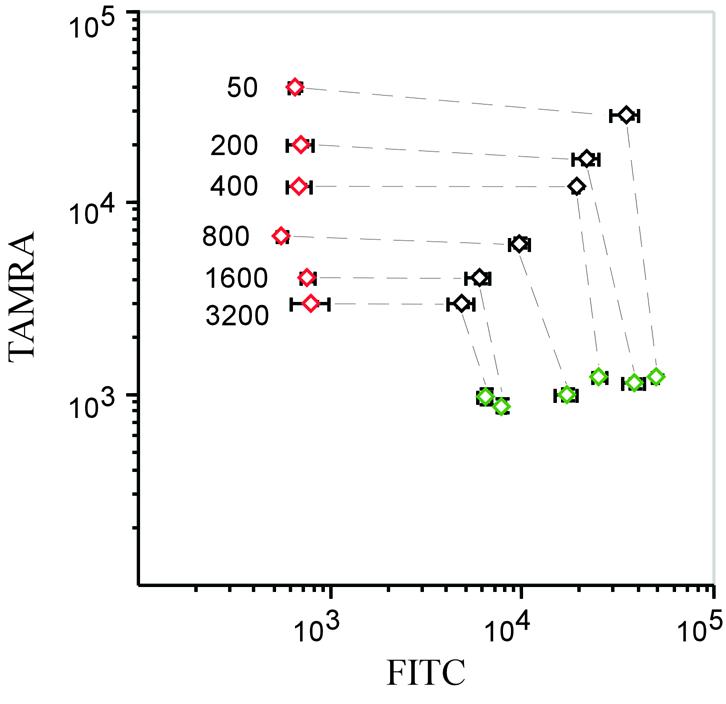
Figure 3.

Effect on signal strength when more probes are analyzed. Constant amounts of circularized probes representing the three possible genotypes at the 1216 locus were mixed with increasing amounts of circularized competitor probes from the 12 other loci. Green and red diamonds represent the homozygous G and T alleles, respectively, while black diamonds represent heterozygotes. The ratios of competitor probes to those of the 1216 locus are indicated in the figure, and the corresponding genotypes are connected by lines. Error bars denote variation within each genotype. Scanner settings were optimized for the 1216 homozygous signals in the 50-fold reaction and the x-axis and y-axis scaled with FITC and TAMRA fluorescence intensities, respectively.
