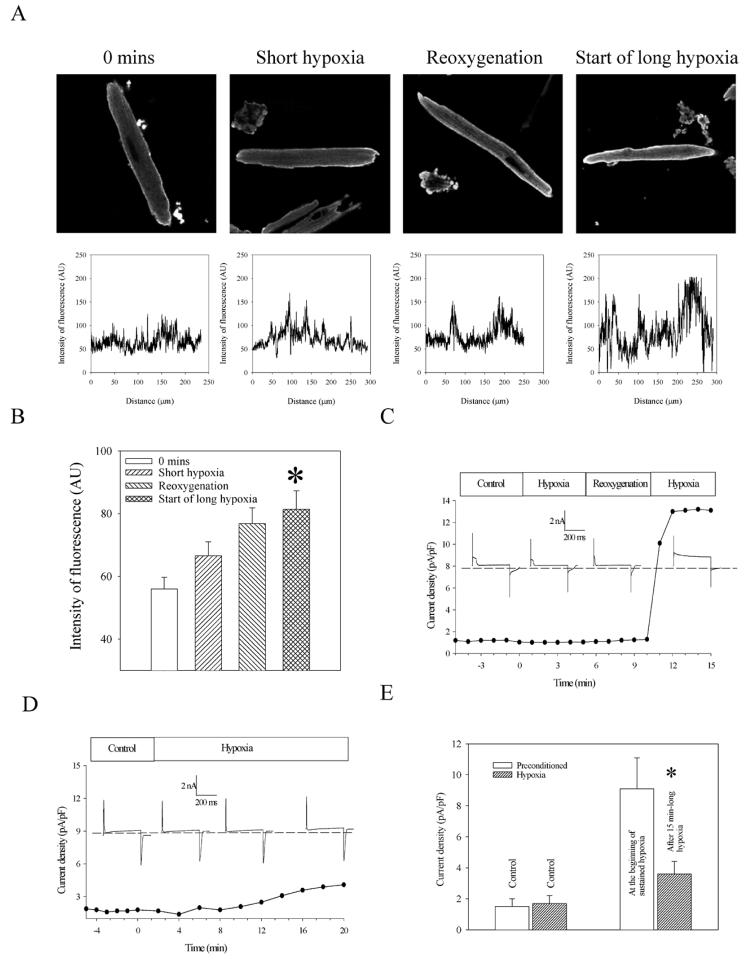
Figure 4. Preconditioning induces trafficking and opening of sarcolemmal KATP channels in cardiomyocytes.
A) Original images and corresponding graphs of cardiomyocytes stained with anti-SUR2A antibody labeled with fluorescein and collected at depicted stages of experimental protocol. Graphs depict intensity of fluorescence drown against distance points in sarcolemma (each graph corresponds to the image above). B) Graph corresponding to A. Each bar represents mean ± se (n=15–17). *P < 0.01. C) Line and scatter graph: Time course of whole cell current density at membrane potential of +80 mV in a cardiomyocyte under control conditions, during preconditioning (5-min-long hypoxia/5-min-long reoxygenation and in first 5 min of long-lasting hypoxia). Insets: Typical whole cell currents at membrane potential +80 mV during different stages of preconditioning. The membrane potential was held at −40 mV, and the current was evoked by a 400 ms current step (to +80mV). Dotted line represents zero current line. D) Line and scatter graph: Time course of whole cell current density at membrane potential of +80 mV in a cardiomyocyte under control conditions and hypoxia. Insets: Typical whole cell currents at membrane potential +80 mV under control conditions and during hypoxia. The membrane potential was held at −40 mV, and the current was evoked by a 400 ms current step (to +80mV). Dotted line represents zero current line. E) Average current density of nonpreconditioned and preconditioned cardiomyocytes exposed to hypoxia. Bars represent mean ± se (n= 5–6), *P < 0.05 when compared with preconditioned cells.

