
Figure 4.
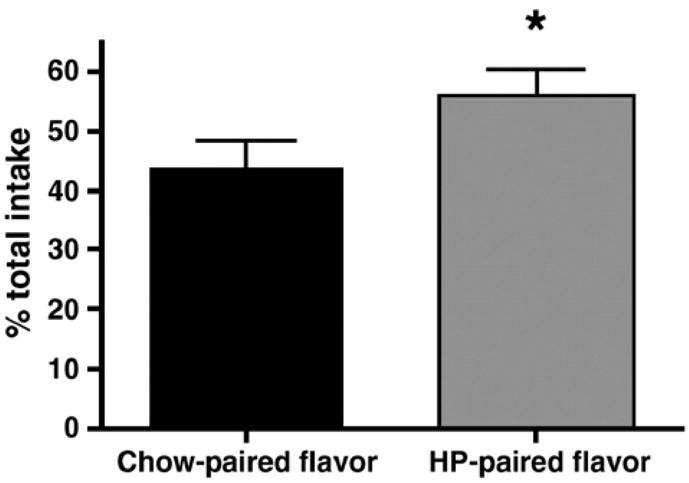
Aversion testing. Rats drank significantly more of the flavor that was paired with the HP diet than they did of the flavor paired with chow. Data are represented as percent total intake. * denotes significance at P < 0.05.
Official websites use .gov
A
.gov website belongs to an official
government organization in the United States.
Secure .gov websites use HTTPS
A lock (
) or https:// means you've safely
connected to the .gov website. Share sensitive
information only on official, secure websites.
Aversion testing. Rats drank significantly more of the flavor that was paired with the HP diet than they did of the flavor paired with chow. Data are represented as percent total intake. * denotes significance at P < 0.05.