
Figure 2.
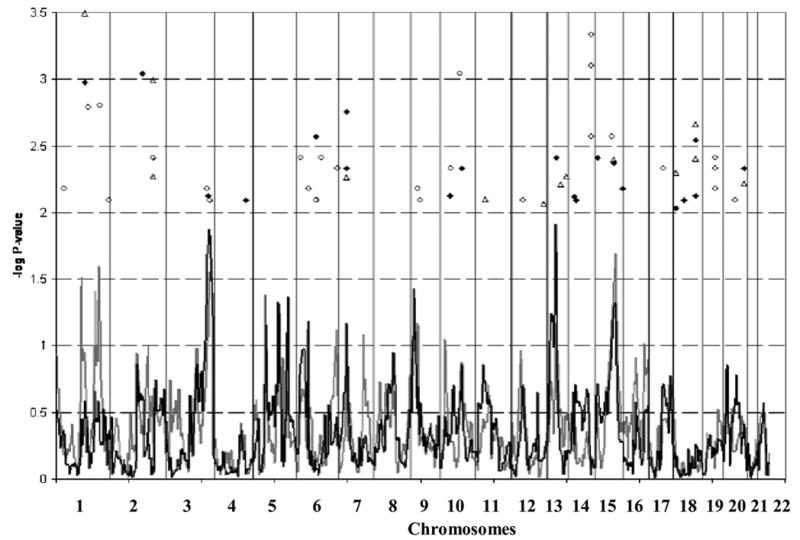
Genome-wide linkage and association results. NPLall (black line), NPLpairs (grey line), single-marker TDT (black diamonds), two-marker TDT (open circles), and FBAT results (open triangles). Markers with a P < 0.01 from the single-marker TDT, two-marker TDT, or FBAT are shown.