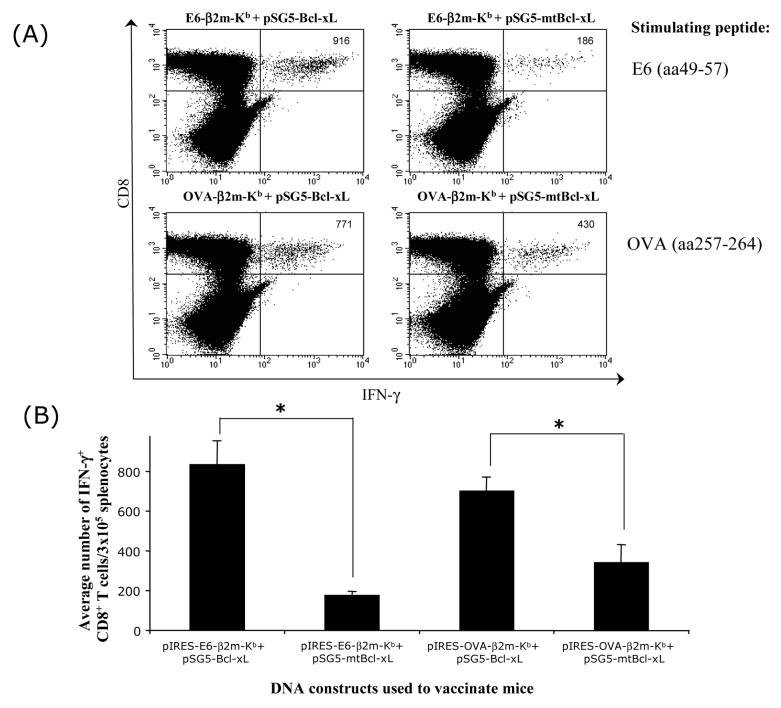
Figure 2. Flow cytometry analysis of the E6- or OVA-specific CD8+ T cell responses in mice vaccinated with combinations of SCT DNA and Bcl-xL or mtBcl-xL DNA vaccines.
C57BL/6 mice were vaccinated intradermally via gene gun with pIRES-E6-β2m-Kb or pIRES-OVA-β2m-Kb combined with pSG5-Bcl-xL or pSG5-mtBcl-xL. Splenocytes obtained from vaccinated mice were cultured with E6 peptide (aa49-57) or OVA peptide (aa257-264) overnight, followed by analysis for CD8 and intracellular IFN-γ staining by flow cytometry. A) Representative flow cytometry data showing the number of IFN-γ-producing E6- or OVA-specific CD8+ T cells in vaccinated mice. Data shown are representative of two separate analyses. B) Bar graph depicting the average number of IFN-γ+ CD8+ T cells from each group of vaccinated mice (*p<0.05).

