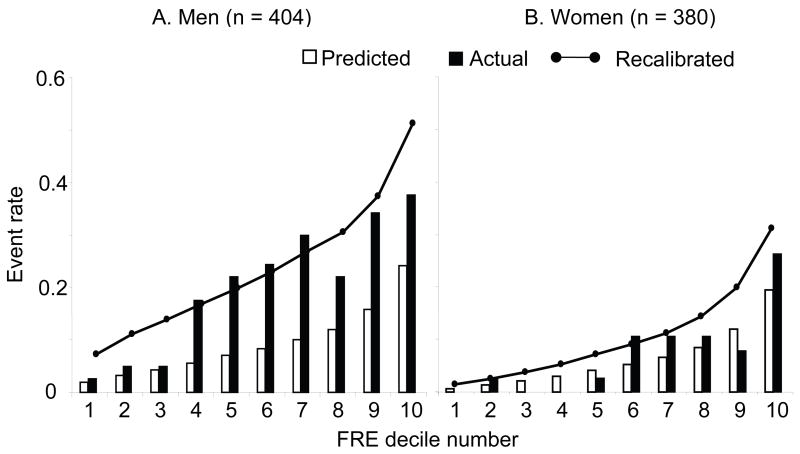
Figure 4.
Comparison of predicted and observed coronary artery disease event rate by deciles of baseline Framingham 10-year risk, by sex. FRE Baseline Deciles in men: 1st: ≤4.0%, 2nd: 4.1–5.803%, 3rd: 5.804–6.81%, 4th: 6.85–8.41%, 5th: 8.42–10.00% 6th: 10.01–11.70%, 7th: 11.72–14.00%, 8th: 14.08–16.41%, 9th: 16.43–21.86%, 10th: ≥22.16%. FRE Baseline Deciles in women: 1st: ≤1.0%, 2nd: 1.31–1.63%, 3rd: 1.66–2.50%, 4th: 2.53–3.56%, 5th: 3.58–4.58% 6th: 4.62–5.67%, 7th: 5.70–7.31%, 8th: 7.32–9.74%, 9th: 9.97–13.76%, 10th: ≥14.16%. The predicted event rate for each baseline FRE decile was the mean FRE within that decile. The observed rate was the actual cumulative event rate at 10-years within each decile. Using the higher cohort-specific average event rate and the cohort-specific offset for mean cohort risk characteristics (G-statistic), a recalibrated Framingham score was calculated. The nodes on the solid line represent the mean recalibrated Framingham risk score for each decile.

