
Fig. 6. Quantitative analyses.
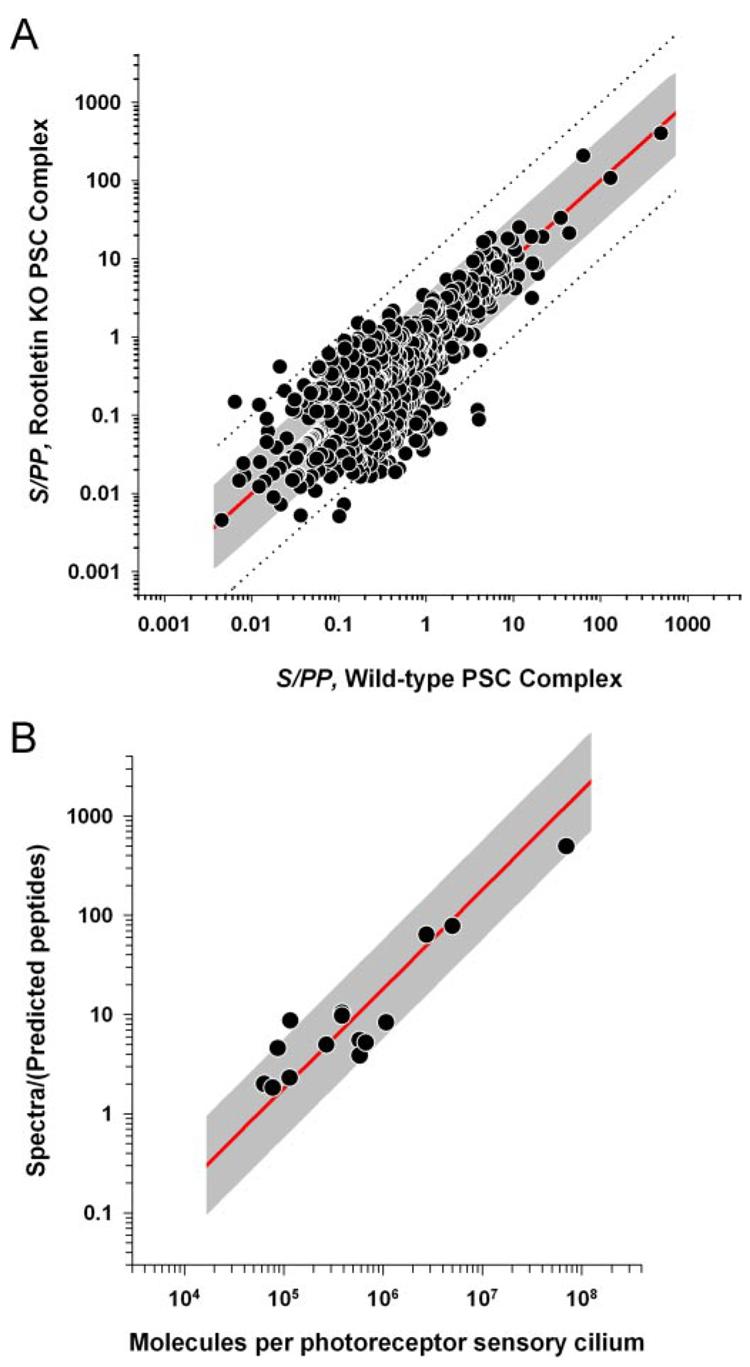
A, S/PP for wild-type and rootletin KO PSC complexes plotted against each other for 1130 shared proteins. The red line indicates unit slope where the S/PP values are equal for proteins in the two different preparations. The dashed lines and gray shading indicate regions within a factor of ±10- and ±3-fold of the unit slope, respectively. B, relationship between MS/MS spectral counts and the copy numbers of 15 different proteins in the mouse photoreceptor outer segment. Details regarding the 15 standard proteins are provided in Supplemental Table S7. The ordinate of each point is the total number of spectra from the protein divided by the predicted number of observable tryptic peptides (S/PP); the abscissa value gives the independently determined NC of the protein in the rod outer segment. In all cases the protein copy numbers were determined relative to rhodopsin whose copy number in the mouse rod outer segment is 7 ×10⁷. The gray line expresses the hypothesis of a linear relationship between copy number and recorded spectra, i.e. S/PP = k × NC. The line was estimated by least squares regression in log/log coordinates with k = 1.805 ×10⁻⁵.