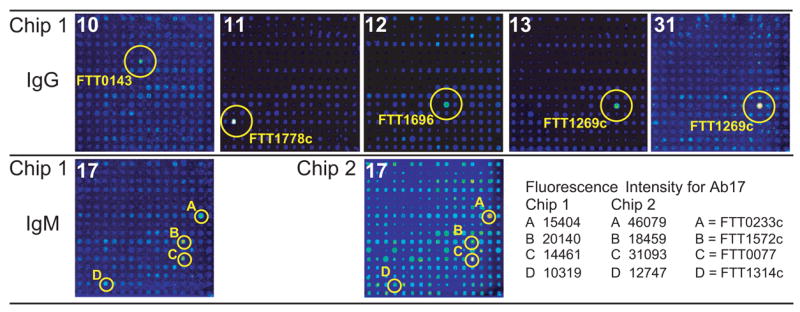
Fig. 6.

Identification of the target antigens of hybridoma antibodies by proteome microarray analysis. Separate pads of Chip 1 were probed with the indicated IgG or IgM hybridoma antibodies at antibody concentrations ranging from 9 to 141 μg/ml, followed by isotype-specific secondary antibodies. Antibody 17, at a concentration of 150 μg/ml, was re-tested on Chip 2. Microarray spots giving the highest fluorescence intensity signals on each pad are circled and the FTT numbers of the corresponding proteins are indicated. The fluorescence intensities of the circled spots are indicated for antibody 17.
