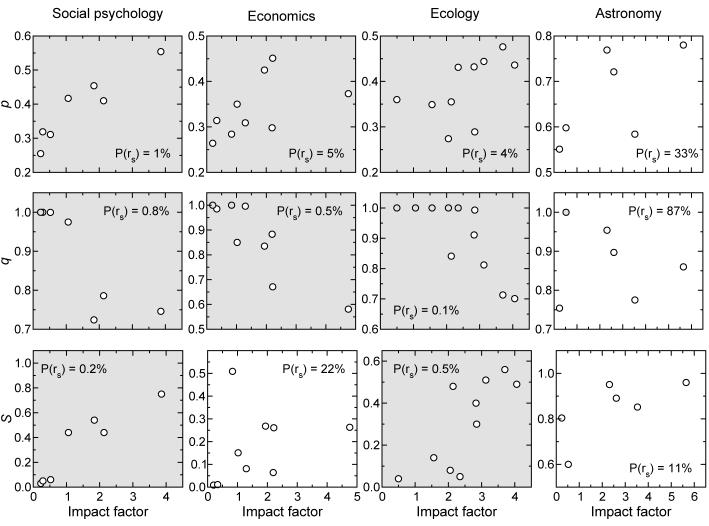
Fig. 5.
Relation between team assembly mechanisms, network structure, and performance. We calculate the values of p, q, and S for several journals in each of the four scientific fields considered. In a few cases, q should be larger than one in order to reproduce the empirical values of fR; in these cases, q is considered one and the corresponding points are shaded. We plot the values of p, q, and S as a function of the impact factor of the journal and then use the Spearman rank-order correlation coefficient rs to determine significant correlations. Shaded graphs indicate significantly correlated variables at the 95% confidence level.

