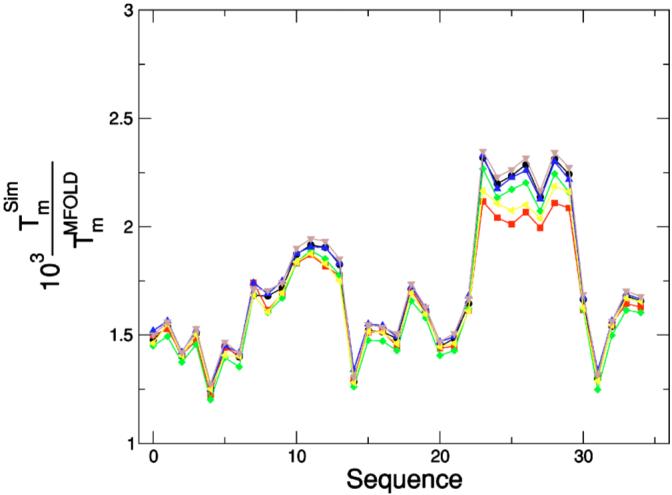
FIG. 13.

Interaction optimization. Comparison of results from simulations with theoretical values for different sets of interactions. Ratio of the melting temperature estimates, , obtained with our model and with Zuker’s Tm server [1,81] for different hairpins with a stem comprising four base pairs and a loop comprising four T’s. Different symbols correspond to changing some of the interaction strength values shown in Fig. 3 to which black symbols ((○) correspond. Blue symbols (○) correspond to reducing the G-C bond strength. Yellow symbols (△) correspond to increasing the A-T bond strength. Green symbols (◁) correspond to decreasing the GC stacking strength. Red symbols (◇) correspond to performing the three previous changes simultaneously. Note these changes of the parameters result in a decrease of the fluctuations, the minimum variance corresponding to changing the strength of AT bonds, GC bonds, and GC stacking interactions at once. We obtained the Tm’s from parallel tempering [80] simulations averaging over 5×10⁶ MCS, with p=0.05.
