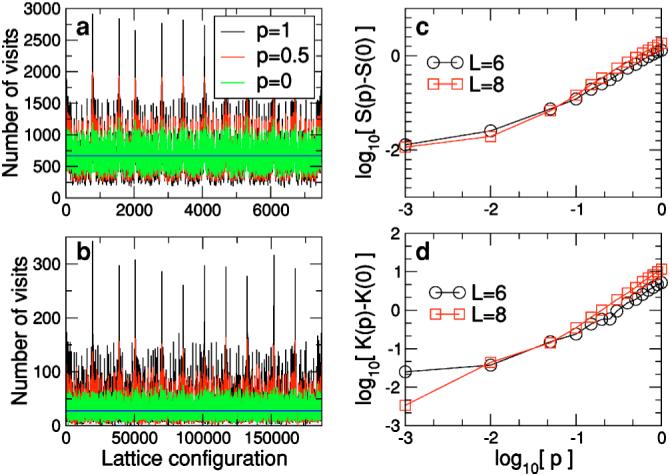
FIG. 6.

(Color online) Sampling of the configuration space. Sampling of the configuration space at infinite temperature for polymers comprising (a) six and (b) eight monomers. Different color lines represent different values of the probability p. At high temperature, one expects all configurations to be sampled with equal rates (whose value is shown by the blue line). The average rate is the number of time steps in the simulation divided by the total number of configurations for the polymer. The number of configurations for a polymer with six (eight) monomers that sits on a three-dimensional lattice and satisfies the stiffness constraints indicated in Fig. 2 is 7500 (186 792). For each polymer size, we collected statistics for 5 000 0000 time steps. Our results demonstrate that the polymer samples conformation space more uniformly for smaller values of p. (c) Skewness S(p) of the distribution of sampling rates of the conformation space of the polymer for different values of p. The skewness measures the asymmetry of the distribution. For perfect sampling, we expect the distribution to be normal, that is, S=0. For p=0, we find S=0.35 (L=6) and S=0.59 (L=8), in good agreement with this expectation. (d) Kurtosis K(p) of the distribution of sampling rates of the conformation space of the polymer. The kurtosis measures the decay rate of the tails of the distribution. For a normal distribution, one has K=3. For p=0, we find K=2.6 for L=6 and K=3.3 for L=8, in good agreement with this expectation. Note that both S and K take smaller values for p<0.01 for the longer polymer. This suggests that as the length of the polymer increases, the differences in the distributions for small p with respect to p=0 become smaller.
