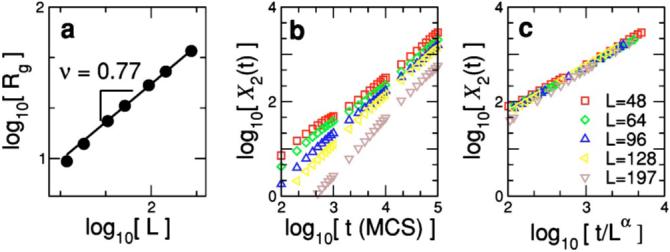
FIG. 7.

(Color online) (a) Average radius of gyration 〈Rg〉∼Lv versus polymer length L. The solid line indicates the best fit to the expected power-law behavior 〈Rg〉∼Lv, obtaining v=0.75±0.07. (b) Mean-squared displacement X2(t) versus time for different polymer lengths L=48-197. Note that X2 grows linearly with time as expected in a diffusive process [78]. (c) By scaling the data in (b) by D∼Lα with α=0.80±0.13, we are able to collapse all the data onto a single curve. The data displayed in the plots are averages over 5000 runs 100 000-150 000 time steps long using p=0.05.
