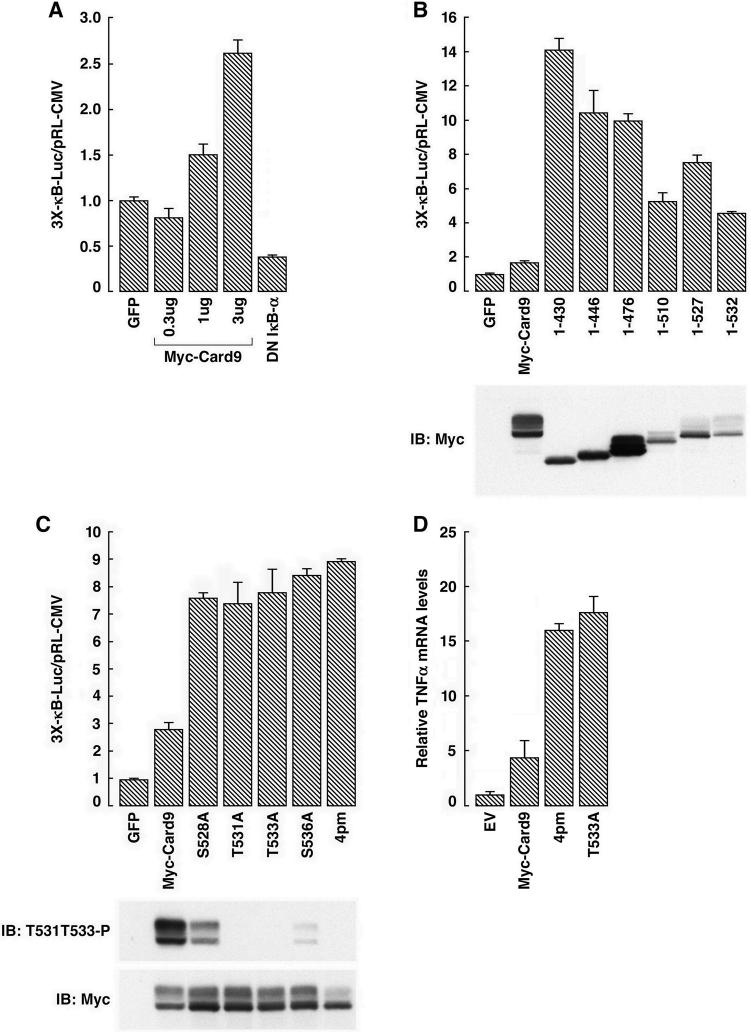
Figure 4. Phosphorylation of the Card9 C-terminus by CK2 inhibits NF-κB activity.
(A) Normalized luciferase values of 293T cells transfected with an NF-κB-responsive luciferase reporter plasmid and plasmids encoding GFP, Card9, or an NF-κB antagonist (DN-IκBα). Error bars = 1 std. dev.
(B and C) Normalized luciferase values and immunoblot of 293T cells transfected to produce the indicated Card9 mutants along with an NF-κB responsive luciferase reporter. On a lighter exposure the Card9 (1−476) top band/bottom band ratio resembled the other truncation mutants (data not shown).
(D) TNFα mRNA levels, normalized to Actin mRNA, of 293T cells transfected to produce the indicated Card9 mutants (measured by RT-PCR).

