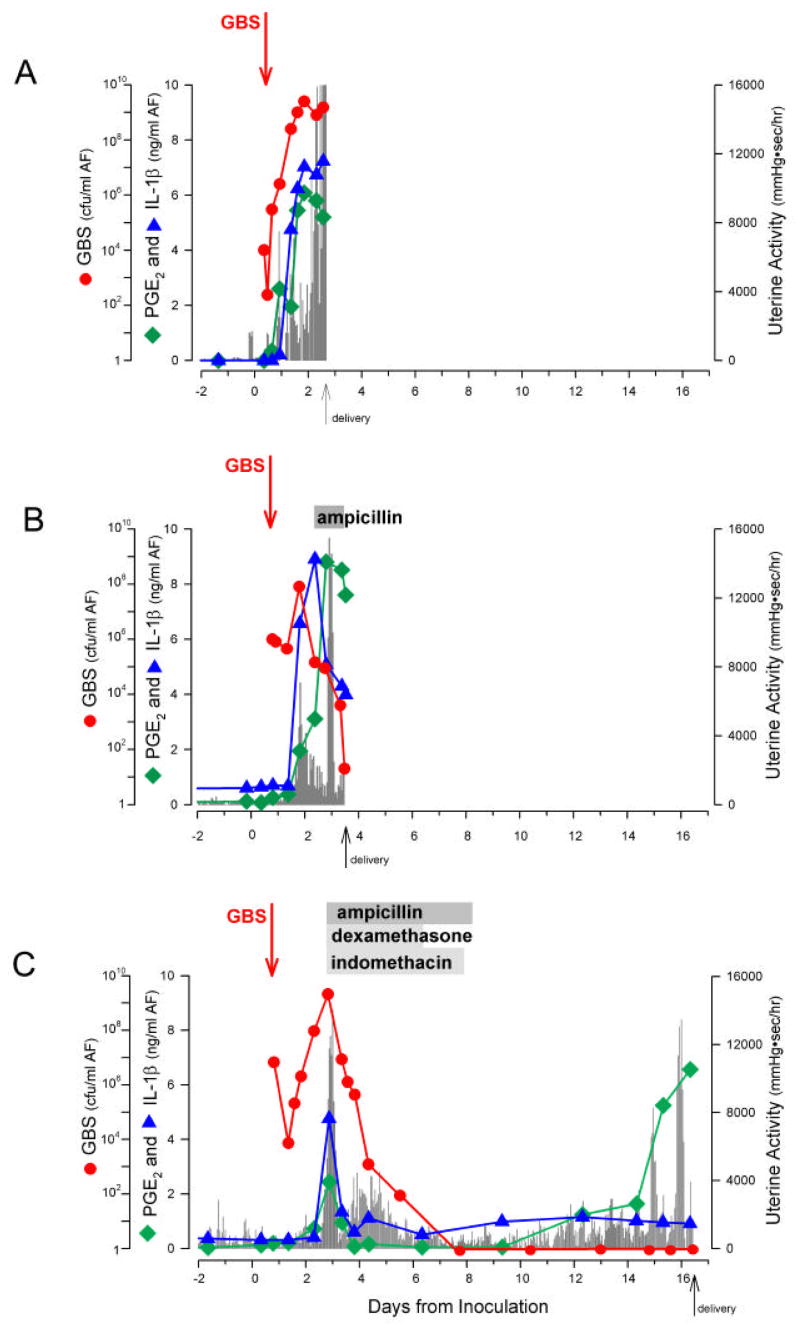
Figure 2.
Graphs depict serial changes after experimental GBS intra-amniotic infection in uterine contractility, GBS cfu/ml, pro-inflammatory cytokines, and prostaglandins for single representative animals in each treatment group: (A) control, (B) AMP alone, and (C) AMP/DEX/INDO. The x-axis indicates days of gestation. The y-axis represents either GBS cfu/ml (left), pg/ml (IL-1β, PGE2; right), or mmHg●sec/hr (HCA; right). Graphical depictions of the changing concentrations of GBS cfu/ml (red circles), IL-1β (blue triangles), PGE2 (green squares), and uterine activity (gray bars; HCA) are indicated. Arrows indicate the time of initial GBS inoculum and administration of a specific treatment.

