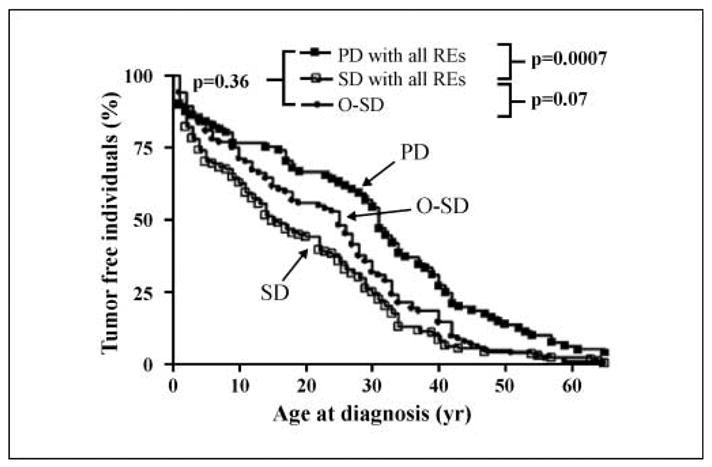
Fig. 2.

p53 functionality and clinical variables: age at diagnosis for the overall tumor spectrum. The percentage of tumor-free individuals is plotted as a function of age up to age 65 (Kaplan-Meier method). The reported P values are the results of a within-cluster resampling analysis (ref. 24; see Materials and Methods). The analyses were restricted to confirmed germline carriers whose age at diagnosis was recorded in the database. For patients with multiple tumors, only the first tumor was considered because secondary malignancies might be influenced by the nature of the tissue, history, and therapeutic interventions on the first tumor. All p53 REs were considered. The number of individuals and families represented in the figure are provided in Table 2.
