
Figure 2. srp-6(ok319) Animals Mounted a Regulatory Volume Decrease.
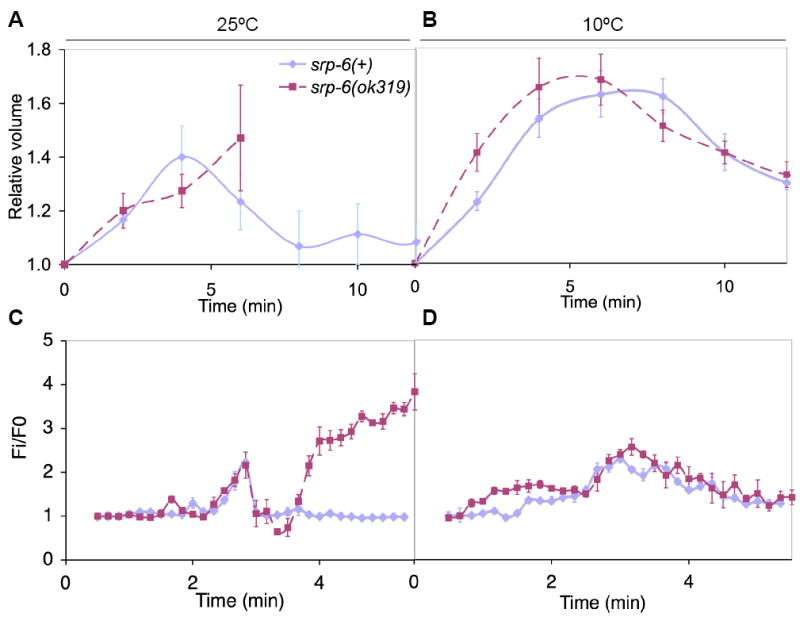
(A-D) Relative changes in cell volume (A, B) and [Ca2+]i (C, D) over time in srp-6(+) (blue) and srp-6(ok319) (red) animals exposed to water at either 25 (A, C) or 10 °C (B, D). The means (± SD) were from a representative experiment (n = 8 animals/group).