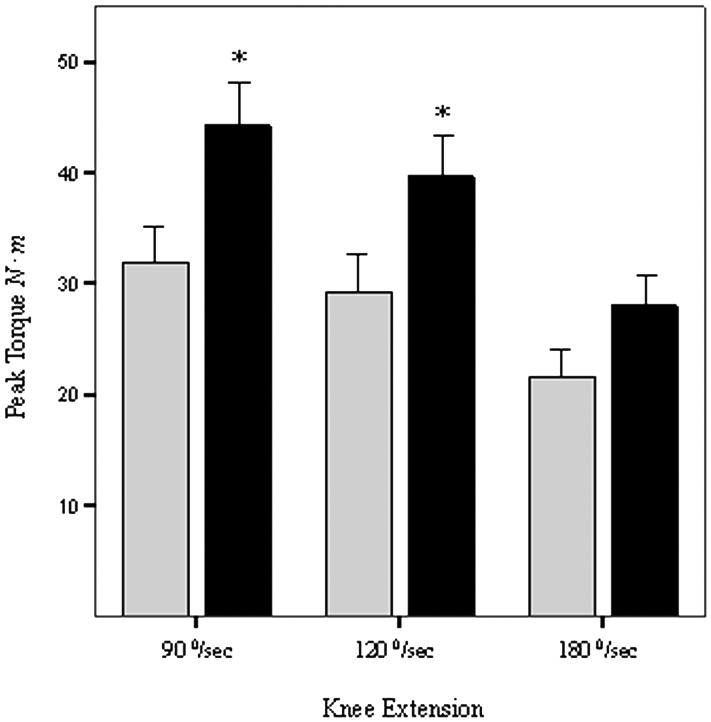
Figure 2. Differences in Isokinetic Strength of Knee Extensors.

Bars represent peak torque at 90, 120, and 180°/sec knee extension angular velocities measured in Newton meters (N ∙ m) by computerized dynamometry (Cybex Inc, Ronkonkoma, NY). Subjects were categorized into two groups; those receiving either 1,25 (OH)2D (calcitriol), or an analog (paricalcitol) (black bars), and those who were not (light bars) at the time of baseline assessment of the NEXT study [21]. Statistical significance is * P<0.05 by ANCOVA, after adjusting for age and gender. Error bars represent the SEM.
